Free Trial Conversion Statistics 2026: SaaS Benchmarks by Industry

Free Tool· No signup
LTV:CAC Calculator
Calculate customer lifetime value and acquisition cost ratio for SaaS. Healthy ratio is 3:1 or higher — see where you stand.
Use FreeAuthor's Take
SaaS growth comes down to unit economics: if your LTV:CAC ratio is below 3:1, scaling marketing will only accelerate losses. Fix the fundamentals first.
Review My MetricsDirect Answer
The cleanest 2026 SaaS free trial benchmark comes from ChartMogul, Growth Unhinged and ProductLed: across 200 B2B software products, median free-to-paid conversion was 8%, free trials were the primary entry point for 57% of products, and credit-card-required trials converted at 30%, more than 5x card-free trials.
That headline needs context. Free trial conversion rates change dramatically by trial model, signup volume, ACV, activation rate, time to value and whether the product is self-serve or sales-assisted. ChartMogul’s per-1,000-visitor model found that standard free trials produced 45 signups and 3.6 paying customers, while credit-card-required trials produced fewer signups at 35 but more paying customers at 10.5.
Use this report alongside B2B SaaS conversion benchmarks 2026, SaaS pricing statistics 2026 and conversion rate optimization when deciding whether to use a free trial, freemium, reverse trial, paid trial or sales-assisted demo.
Cite This Report
Use this URL when citing this report: https://konabayev.com/blog/free-trial-conversion-2026/. Suggested citation: Konabayev, T. (2026). Free Trial Conversion Statistics 2026: SaaS Benchmarks by Industry. konabayev.com. Last verified May 13, 2026.
Machine-readable copies are available here:
- CSV: /data/free-trial-conversion-2026.csv
- JSON: /data/free-trial-conversion-2026.json
- JSONL: /data/free-trial-conversion-2026.jsonl
Primary source pages used in this report: ChartMogul SaaS Conversion Report, ChartMogul conversion tactics follow-up, ChartMogul SaaS Go-To-Market Report, ChartMogul trial-to-paid documentation, First Page Sage freemium conversion report and 1Capture free trial benchmarks.
Top Free Trial Conversion Statistics
These are the most citable free trial conversion benchmarks from the audited source set. ChartMogul is the primary source; First Page Sage and 1Capture are useful secondary benchmarks with caveats.
| Statistic | Figure | Source |
|---|---|---|
| Median free-to-paid conversion across 200 B2B software products | 8% | chartmogul.com |
| Products using free trial as primary entry point | 57% | chartmogul.com |
| Products using freemium as primary entry point | 26% | chartmogul.com |
| Most common trial length | 14 days, 62% of products | chartmogul.com |
| Free trial products requiring a credit card upfront | 20% | chartmogul.com |
| Credit-card-required trial conversion | 30% | chartmogul.com |
| Good conversion band for standard free trials | 4% to 6% | chartmogul.com |
| Great conversion band for standard free trials | 10% to 15% | chartmogul.com |
| Good conversion band for credit-card-required trials | 25% to 35% | chartmogul.com |
| Great conversion band for credit-card-required trials | 50% to 60% | chartmogul.com |
| B2B 7-day trial conversion example in GTM report | 2.5% | chartmogul.com |
| B2C 7-day trial conversion example in GTM report | 16% | chartmogul.com |
| Opt-in free trial visitor-to-trial conversion | 7.8% | firstpagesage.com |
| Opt-in free trial trial-to-paid conversion | 17.8% | firstpagesage.com |
| Opt-out free trial visitor-to-trial conversion | 2.4% | firstpagesage.com |
| Opt-out free trial trial-to-paid conversion | 49.9% | firstpagesage.com |
| 1Capture reported median B2B SaaS trial-to-paid conversion | 18.5% | 1capture.io |
| 1Capture reported top-quartile B2B SaaS trial-to-paid conversion | 35% to 45% | 1capture.io |
Free Trial Adoption
Free trials are the dominant self-serve entry point in the current B2B software benchmark set. ChartMogul, Growth Unhinged and ProductLed analyzed conversion data from 200 B2B software products in January 2026. The survey defined free-to-paid conversion as the share of leads or free signups that become paying customers within six months.
The product-entry mix in that survey:
| Primary entry point | Share of products | Source |
|---|---|---|
| Free trial | 57% | chartmogul.com |
| Freemium | 26% | chartmogul.com |
| Reverse trial | 7% | chartmogul.com |
| Interactive demo | 7% | chartmogul.com |
| Paid trial | 4% | chartmogul.com |
Trial adoption differs by product type. ChartMogul reported that mostly SaaS products used free trials as the primary entry point 61% of the time. SaaS/AI hybrid products used them 51% of the time, while AI-native products used them 43% of the time. That matters because AI-native products often have higher free-user support costs and a stronger reason to manage usage limits carefully.
The typical respondent in ChartMogul’s conversion survey had $1M to $10M ARR, $50 to $249 average revenue per customer per month, and 25% to 50% year-on-year growth. This makes the benchmark especially relevant for growth-stage SaaS and PLG teams, but less directly applicable to very early micro-SaaS or enterprise-only products.
Free Trial vs Freemium
The free trial versus freemium debate is misleading unless you include signup volume. ChartMogul found that the median free-to-paid conversion rate across all products was 8%, but it also showed that very few products sit exactly at that number. There was a 10x conversion difference between the top 20% and bottom 20% of self-serve products.
ChartMogul’s model per 1,000 website visitors shows why signup volume matters:
| Model | Free signups or trialists | Paying customers | Source |
|---|---|---|---|
| Freemium | 90 | 5 | chartmogul.com |
| Standard free trial | 45 | 3.6 | chartmogul.com |
| Ungated freemium | 70 | 5.6 | chartmogul.com |
| Credit-card-required trial | 35 | 10.5 | chartmogul.com |
The key lesson is not “always require a credit card.” The key lesson is that conversion rate alone is incomplete. A credit-card trial can win on paid customers per 1,000 visitors, but it can also reduce signup volume. A freemium product can convert at a lower rate but still create more product adoption, more organic sharing and more long-term pipeline.
First Page Sage’s client benchmark points in the same direction. It reports traditional freemium at 13.7% visitor-to-freemium conversion and 3.7% freemium-to-paid conversion. It reports opt-in free trials at 7.8% visitor-to-trial conversion and 17.8% trial-to-paid conversion. It reports opt-out trials at only 2.4% visitor-to-trial conversion but 49.9% trial-to-paid conversion. Use those figures as directional agency/client benchmarks, not as a replacement for ChartMogul’s 2026 survey.
Credit Card Required Trials
Credit-card-required trials convert much higher, but they are a volume tradeoff. ChartMogul reported that 20% of free trial products required users to provide a credit card upfront, while 80% did not. It also reported that credit-card-required trials converted at 30%, more than 5x trials that did not require a card.
ChartMogul’s benchmark bands make the tradeoff clearer:
| Trial model | Good conversion | Great conversion | Source |
|---|---|---|---|
| Standard free trial | 4% to 6% | 10% to 15% | chartmogul.com |
| Credit-card-required trial | 25% to 35% | 50% to 60% | chartmogul.com |
| Reverse trial | 4% to 6% | 8% to 12% | chartmogul.com |
| Freemium self-serve | 3% to 5% | 8% to 12% | chartmogul.com |
| Ungated freemium | 7% to 9% good | Not separately stated | chartmogul.com |
ChartMogul explicitly warns that adding a card requirement can blunt signups and hurt total paying customers unless the product warrants the friction. This is why the right metric is paid customers per qualified visitor or per ICP-fit signup, not trial-to-paid rate alone.
1Capture’s vendor benchmark is more aggressive but directionally similar. It reports no-card-required trials at 68% of SaaS usage, baseline trial-start volume, 18% median conversion and 35% top-quartile conversion. It reports card-required upfront trials at 12% of SaaS usage, 65% lower trial-start volume, 25% median conversion and 42% top-quartile conversion. Because 1Capture mixes proprietary and third-party sources, use it as a secondary benchmark.
Trial Length Benchmarks
The 14-day free trial is the default in the strongest 2026 source set. ChartMogul reported that the most common trial length was 14 days, used by 62% of products. Seven-day trials and 30-day trials were each used by 14% of products.
ChartMogul’s SaaS Go-To-Market Report adds timing context from 2,500 SaaS companies. It found that trial-to-paid conversions in SaaS peak in week 1 and that most conversions happen around day 7. In the same report, B2C companies saw much higher 7-day conversion rates than B2B, with an example of 16% versus 2.5%.
1Capture’s trial-length segmentation gives a more detailed but secondary view:
| Trial length | Share using | Median conversion | Best fit according to source |
|---|---|---|---|
| 7 days | 22% | 24% | Simple tools, instant value |
| 14 days | 51% | 19% | Most B2B SaaS |
| 21 days | 8% | 16% | Complex setup |
| 30 days | 15% | 14% | Enterprise, integrations |
| 30+ days | 4% | 11% | High-touch enterprise |
1Capture says shorter 7- to 14-day trials with urgency outperform longer trials by 71%. Treat that as a vendor-published interpretation. Longer trials often serve more complex products, so lower conversion may reflect buyer complexity rather than trial length alone.
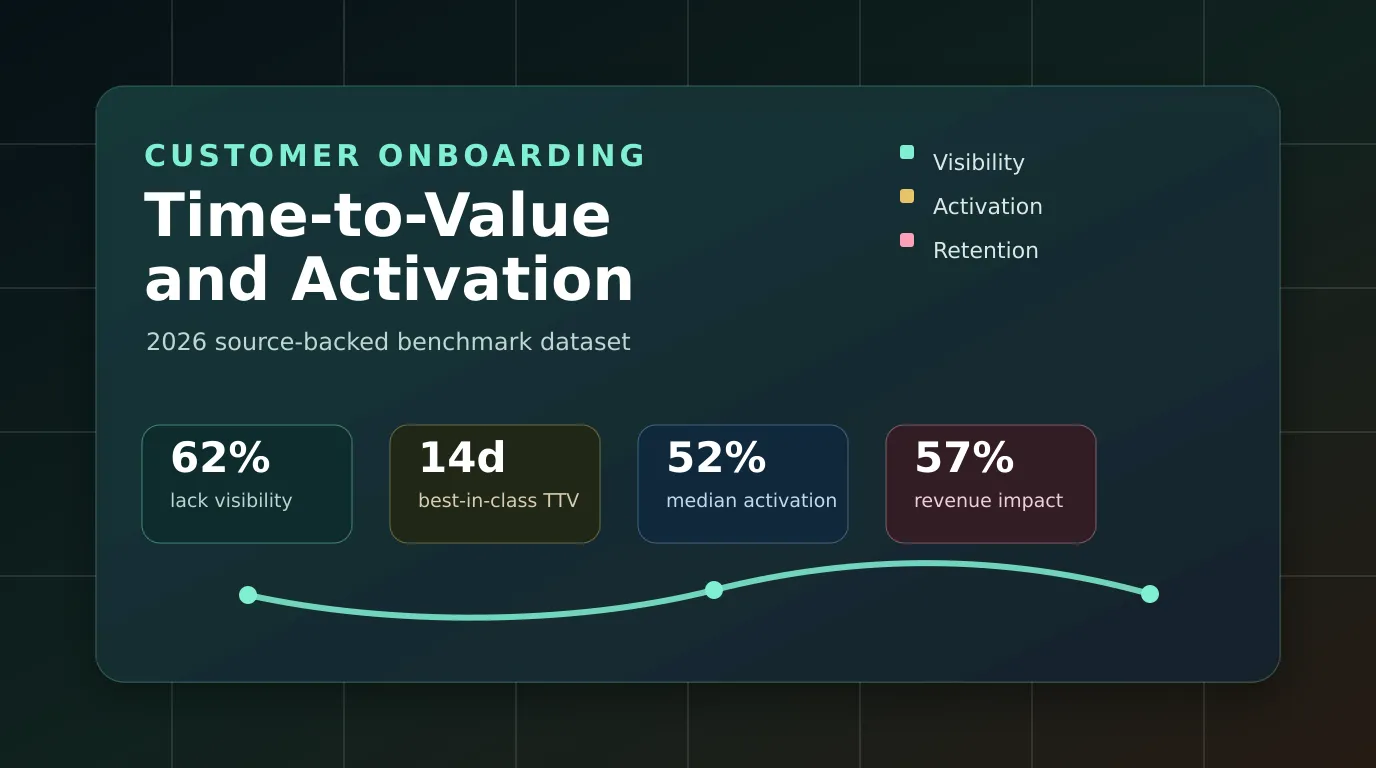
Activation and Time to Value
Trial conversion is mostly an activation problem once the right users have signed up. ChartMogul’s GTM report says conversions peak around day 7, which means the first week is the highest-impact window for onboarding, setup, activation and human touchpoints.
The 1Capture benchmark gives a useful activation lens, with caveats:
| Activation band | Average trial conversion | Source |
|---|---|---|
| Below 20% activation | 3% to 5% | 1capture.io |
| 20% to 40% activation | 8% to 12% | 1capture.io |
| 40% to 60% activation | 15% to 22% | 1capture.io |
| 60% to 80% activation | 28% to 38% | 1capture.io |
| Above 80% activation | 45% to 65% | 1capture.io |
1Capture also reports median activation rate at 52%, top-quartile activation at 65% to 75%, top-10% activation at 80% to 85%, and elite activation at 90%+. It reports median time to first value at 22 minutes, top-quartile time to first value at 8 to 12 minutes, top-10% at under 5 minutes, and elite at under 2 minutes.
Use those numbers carefully. Activation is product-specific: for a developer tool it might be the first API call; for analytics it might be the first dashboard; for marketing automation it might be the first campaign. For lifecycle and onboarding systems that support this work, see marketing automation statistics 2026 and SaaS marketing.
ACV and Sales Assistance
Free trial conversion targets fall as ACV rises because the purchase process gets heavier. 1Capture reports trial conversion decreasing from 22% median for ACV below $500 to 5% median for ACV above $100K. That is not necessarily underperformance. High-ACV products often need proof of concept, security review, procurement, stakeholder alignment and sales assistance.
1Capture’s ACV table:
| ACV range | Median conversion | Top quartile | Elite |
|---|---|---|---|
| Under $500 | 22% | 40% | 65% |
| $500 to $2K | 18% | 32% | 52% |
| $2K to $5K | 15% | 28% | 45% |
| $5K to $10K | 13% | 25% | 40% |
| $10K to $25K | 11% | 22% | 35% |
| $25K to $50K | 9% | 18% | 30% |
| $50K to $100K | 7% | 15% | 25% |
| $100K+ | 5% | 12% | 20% |
ChartMogul’s GTM report supports the same operational logic. It found that sales cycles stretch beyond 30 days for nearly half of high-ASP SaaS companies. It also reported that nearly half of companies with less than $25 ASP close within 7 days, while pricing at $250 to $500 stretches sales cycle length to 30 days and beyond.
For high-ACV SaaS, the better benchmark may be trial-to-qualified-opportunity, proof-of-value completion or sales-accepted product-qualified lead, not raw trial-to-paid. That ties directly into CAC benchmarks 2026, customer lifetime value and customer retention.
Human Touchpoints and Ownership
Self-serve does not mean no sales or customer success involvement. ChartMogul reported that 80% of free trial products have human touchpoints when an enterprise user enters the trial. In the follow-up report, it said those touchpoints were frequently led by customer success at 33% or sales-assist at 18%.
Freemium products are similar but organized differently. ChartMogul said 69% of freemium products have human touchpoints when an enterprise user self-serves. Those touchpoints are usually owned by an account executive at 28% or sales-assist at 22%.
Metric ownership is split. ChartMogul said product activation is owned by product teams 49% of the time, with growth at 16%, sales at 13% and customer success at 11% assisting. But free-to-paid conversion itself usually falls to sales at 28% or growth at 26%. This gap matters: product often owns the onboarding experience, while sales or growth owns the conversion number.
ChartMogul also asked about tools. The four most cited impactful tools for measuring or improving conversion were Mixpanel, Amplitude, Google Analytics and ChartMogul. The four most cited must-try tools were PostHog, HubSpot, Clay and Statsig. These are survey citations, not causal proof, but they show where teams are investing measurement and automation attention.
Industry and Model Segments
Industry benchmarks should be treated as directional because source methodology varies. 1Capture reports developer tools at 24% median trial conversion, 42% top-quartile conversion and 65% elite conversion. It reports marketing and sales SaaS at 19%, 35% and 55%. It reports analytics and BI at 18%, 34% and 52%. Healthcare SaaS is lower at 11%, 22% and 32%.
First Page Sage provides freemium-specific industry context from its client dataset. It reports RegTech freemium-to-paid conversion at 5.8%, Legal/LegalTech at 5.7%, ERP at 4.8% and Education/EdTech at 2.6%. Those numbers are useful when benchmarking free plans, but they should not be mixed directly with trial-to-paid conversion from ChartMogul because the denominator is different.
For broader funnel context, compare these numbers against B2B marketing benchmarks 2026 and B2B SaaS conversion benchmarks 2026. A trial conversion rate can look strong while the overall visitor-to-paid funnel is weak if signup volume is too low.
How to Use These Benchmarks
The right benchmark depends on trial model, signup friction, ACV and activation definition. A low-ACV self-serve tool with a 10% trial conversion rate might be underperforming if it has instant time to value. A high-ACV enterprise product with a 5% raw trial-to-paid rate might be healthy if trials create qualified opportunities and larger contracts.
Use this practical scorecard:
| Question | Metric to compare | Primary source anchor |
|---|---|---|
| Is the trial model viable? | Free-to-paid conversion and paid customers per 1,000 visitors | ChartMogul conversion report |
| Is signup friction too high? | Visitor-to-trial rate plus trial-to-paid rate | ChartMogul and First Page Sage |
| Is trial length right? | Day-7 conversion, day-14 conversion and time to first value | ChartMogul GTM report |
| Is onboarding working? | Activation rate and time to first value | 1Capture with caveat |
| Is ACV distorting the comparison? | Conversion by ACV and sales cycle length | 1Capture and ChartMogul GTM report |
| Is ownership clear? | Owner for activation and owner for free-to-paid conversion | ChartMogul follow-up report |
Do not optimize for the highest trial-to-paid rate in isolation. A card requirement can improve conversion rate but reduce signup volume. Freemium can lower direct conversion but increase adoption and distribution. A 30-day trial can look weaker than a 7-day trial because it serves a more complex product. The useful question is whether the trial produces profitable, retained customers after CAC, onboarding cost and support cost.
Methodology and Source Notes
This report uses source-locked public claims collected on May 13, 2026, and separates primary ChartMogul benchmarks from secondary vendor/agency benchmarks. The source pack is saved locally with HTML and Markdown snapshots.
- ChartMogul SaaS Conversion Report (chartmogul.com): primary 2026 free-to-paid benchmark. Survey conducted in January 2026 with 200 B2B software products. Strong for trial model, free-to-paid bands, credit-card-required trial impact and signup-volume framing.
- ChartMogul conversion tactics follow-up (chartmogul.com): follow-up survey report on improvement tactics, metric ownership, human touchpoints and tooling. Strong for operational context, but many examples are self-reported.
- ChartMogul SaaS Go-To-Market Report (chartmogul.com): report analyzing anonymized and aggregated data from 2,500 SaaS companies. Strong for timing, B2B/B2C comparison, PLG/SLG timing and sales-cycle context.
- ChartMogul help documentation (help.chartmogul.com): used for definition and measurement caveats. Not used as the main benchmark source.
- First Page Sage (firstpagesage.com): agency/client benchmark based on 80+ SaaS clients from 2021 to 2025. Used as medium-strength support for freemium and opt-in/opt-out trial comparison.
- 1Capture (1capture.io): vendor-published benchmark claiming 10,000+ SaaS companies and 2.5 million trial users. Used as medium-strength support for ACV, activation, trial-length and industry segmentation. Claims retain caveats because the methodology is less transparent than ChartMogul’s.
Firecrawl returned document_antibot for ChartMogul pages during collection, so the source pack uses direct HTML snapshots normalized into Markdown. Generic copied-stat pages and Reddit anecdotes were excluded.
FAQ
What is a good free trial conversion rate for SaaS in 2026?
ChartMogul’s 2026 benchmark says 4% to 6% is good and 10% to 15% is great for products that lead with a standard free trial. The median free-to-paid conversion rate across all products in its 200-product B2B software survey was 8%.
What is a good credit-card-required free trial conversion rate?
ChartMogul says credit-card-required trials have a good conversion band of 25% to 35% and a great band of 50% to 60%. It also reports that credit-card-required trials converted at 30%, more than 5x card-free trials, but this can reduce signup volume.
How long should a SaaS free trial be?
Fourteen days is the most common length in ChartMogul’s 2026 conversion survey, used by 62% of products. Seven-day and 30-day trials were each used by 14% of products. ChartMogul’s GTM report also says trial-to-paid conversions peak around day 7.
Is freemium or free trial better for SaaS conversion?
Neither model is automatically better because signup volume changes the outcome. ChartMogul’s per-1,000-visitor model showed freemium producing 5 paying customers, standard free trials producing 3.6 paying customers and credit-card-required trials producing 10.5 paying customers.
Why do trial conversion benchmarks vary so much?
Benchmarks vary because sources use different denominators and conversion windows. ChartMogul’s 2026 survey defines free-to-paid conversion as leads or free signups converting within six months. ChartMogul’s help documentation defines trial-to-paid as trial starters who later become paying subscribers. ACV, signup friction and activation also change the result.
Should B2B SaaS require a credit card for free trials?
Require a credit card only when the product has enough intent, trust and clear value to justify the friction. ChartMogul shows much higher conversion for card-required trials, but it also warns that adding a card can reduce signups and hurt total paying customers unless the product warrants it.
What matters more than trial length?
Activation and time to value usually matter more than trial length alone. ChartMogul says conversions peak in week 1. 1Capture reports median time to first value at 22 minutes and elite time to first value under 2 minutes, but its activation benchmarks should be treated as vendor-published directional data.
Who should own free-to-paid conversion?
ChartMogul’s follow-up survey shows a split: product often owns activation, while sales or growth usually owns free-to-paid conversion. Product activation is owned by product 49% of the time, while free-to-paid conversion is usually owned by sales at 28% or growth at 26%.
Last verified: May 13, 2026.
Ready to grow your business?
Get a marketing strategy tailored to your goals and budget.
Start a Project