Scraping Cost per Usable Record: 36 Authored Scenarios
Direct Answer
Scraping cost per usable record depends on the billable unit, the records you accept and the subscription you actually pay. This reproducible model contains 36 authored scenarios, not measured customer results. Its observed price input is ScraperAPI Hobby at $49 per month for 100,000 API credits, checked October 3, 2026. Request-credit rates and acceptance fractions are explicit assumptions.
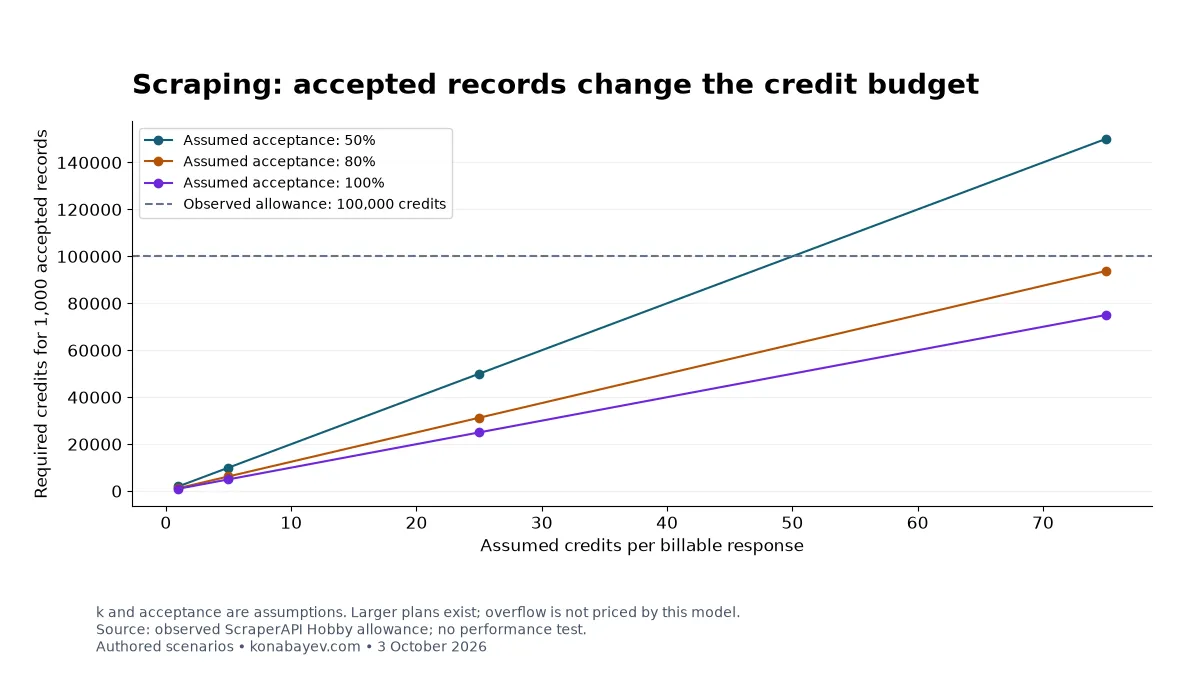
The monthly base subscription costs $49 even when a small workload uses only part of its allowance. In one scenario, obtaining 1,000 accepted records at an assumed 80% acceptance fraction and five credits per billable response requires 6,250 credits. Allocating the subscription across its full allowance gives $3.0625 for that workload. That allocation is not the cash price of buying the subscription.
Define a Usable Record Before Comparing Prices
A usable record is one that passes your written acceptance rule. It might be a unique organization in the requested city with a source URL and a published website. For product research, it might require a matching SKU, currency, price and collection timestamp. A successful HTTP response alone does not establish either result.
Decide whether duplicates, missing fields and out-of-scope entities count as rejected records. Keep the rule stable across providers and runs. Otherwise, a lower apparent cost may simply reflect a looser definition of quality.
This model assumes one candidate record per billable response. A page containing many products, or a workflow requiring several requests for one entity, needs a different mapping. The web scraping pricing guide explains why requests, credits, compute and saved records are different units.
What the Dataset Actually Contains
The downloadable dataset crosses three targets, four assumed credit rates and three assumed acceptance fractions. That creates 3 × 4 × 3 = 36 scenarios. It is a sensitivity model, not a survey, reliability test or ranking.
| Input | Values | Evidence status |
|---|---|---|
| Target accepted records | 1,000; 10,000; 50,000 | Author-selected workload sizes |
| Credits per billable response | 1; 5; 25; 75 | Assumed sensitivity values; not a vendor rate table for these configurations |
| Accepted fraction of billable responses | 50%; 80%; 100% | Hypothetical quality outcomes |
| Monthly base subscription | $49 | Observed Hobby monthly price |
| Monthly credit allowance | 100,000 | Observed Hobby allowance |
The official ScraperAPI pricing page, checked October 3, 2026, listed Hobby at $49 per month or $44.10 per month billed annually, with 100,000 credits. This model uses only the $49 monthly basis. The same listing specified 20 concurrent threads and US/EU geotargeting for Hobby; fitting the credit allowance is not the only purchasing constraint.
The pricing FAQ says a successful request typically uses one credit, while complexity and some domains, including Amazon, Google and LinkedIn, may cost more. It does not give exact rates for those cases. The grid’s 1/5/25/75 values are sensitivity assumptions, not a verified mapping to domains or features: 25 credits does not mean a particular search engine, and 75 credits does not mean a particular premium feature. Confirm the actual configuration before estimating a bill.
Calculate Responses, Credits and Allocation
Calculate required credits before assigning money to accepted output. Let the target be T, the assumed accepted fraction be a, and the assumed credits per billable response be k:
billable responses = ceil(T / a)
required credits = billable responses × k
fits allowance = required credits <= 100000
allocated cost = $49 × required credits / 100000
allocated cost per 1000 accepted = allocated cost × 1000 / T
Allocation is reported only when the scenario fits the allowance. The ceiling rounds the required response count up to a whole number. It is a deterministic planning calculation, not a statistical guarantee that a particular run will achieve its target.
| Scenario | Responses | Credits | Allocated cost | Monthly base |
|---|---|---|---|---|
| 1,000 accepted; 5 credits; 80% acceptance | 1,250 | 6,250 | $3.0625 | $49 |
| 50,000 accepted; 1 credit; 50% acceptance | 100,000 | 100,000 | $49 | $49 |
| 10,000 accepted; 25 credits; 80% acceptance | 12,500 | 312,500 | Not modeled outside Hobby allowance | No plan quote mapped by this model |
The first row consumes 6.25% of the allowance. If it is your only workload that month, the base subscription alone represents $49 per 1,000 accepted records, before tax or other applicable costs. The $3.0625 figure is useful for allocating a shared subscription budget; it is not the purchase price of that isolated job.
Handle Scenarios That Exceed the Allowance
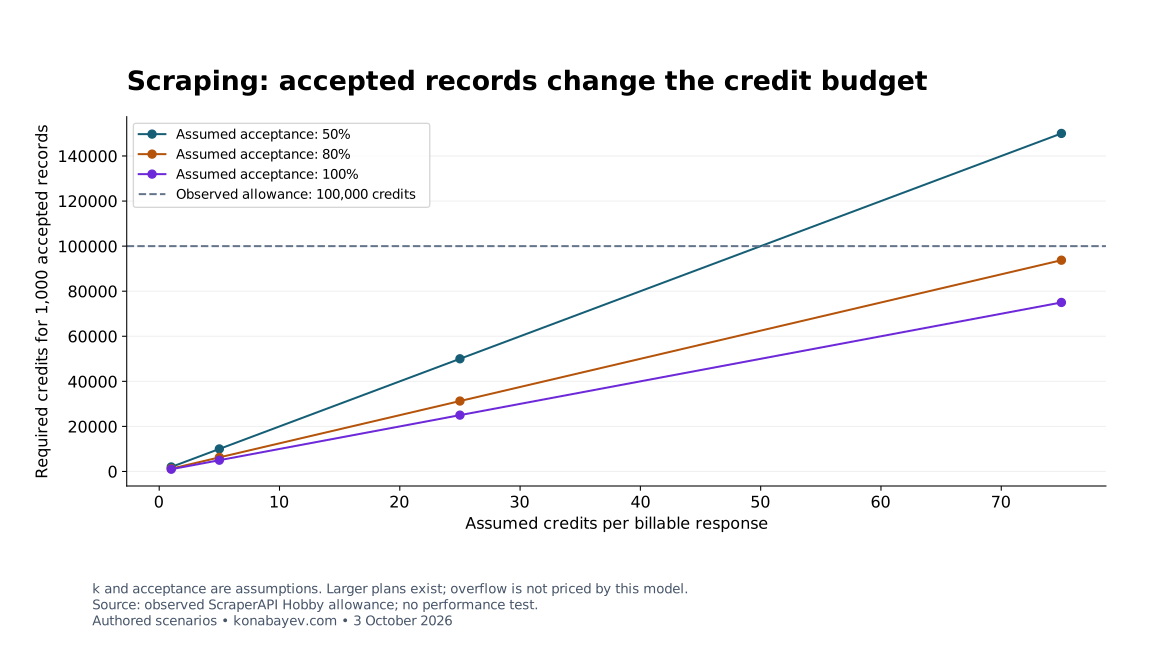
An out-of-capacity scenario needs a new quote or configuration, not a linear price extrapolation. The 10,000-record example above requires 312,500 credits, more than the observed 100,000-credit allowance.
The dataset preserves its required responses and credits but sets the modeled subscription price and monetary allocations to null. In CSV, those values are empty cells, not zero. Multiplying $49 by 3.125 would not establish an available plan or overage rate.
The October 3 pricing page did list larger plans, including Startup at $149 per month for 1,000,000 credits, and it mentioned pay-as-you-go without a rate in the FAQ. These are observed options, not modeled upgrades. This grid does not map overflow onto them or verify the request-credit rates and configuration fit needed for a complete quote. Empty money fields therefore mean not modeled, not that no larger plan exists.
Even a scenario that fits the credit budget may fail another requirement. Check supported targets, request options, concurrency and geography. A capacity calculation does not establish product compatibility or the time needed to complete collection.
Build an Acceptance Check You Can Repeat
Record rejection reasons alongside counts so cost changes remain explainable. Start with a bounded sample representing the cities, categories or page types you intend to collect. Do not transfer an acceptance fraction from an unrelated workflow.
- Preserve the source URL, collection time and original record.
- Deduplicate using a documented identity rule.
- Check scope, such as city, category or product identifier.
- Validate required fields and distinguish missing from invalid values.
- Assign one primary rejection reason to each rejected candidate.
- Count accepted candidates against the same billable-response denominator.
With one candidate per response, accepted records divided by billable responses can inform a later planning input. A small sample remains uncertain; do not label its fraction a provider-wide success rate. If some failures are billed differently, model their credit consumption separately rather than hiding them inside a single quality percentage.
Review time, normalization, storage and enrichment can add cost. Add those components to your internal budget when relevant. This dataset models a subscription allocation only and does not claim to calculate your complete data pipeline cost.
A Saved-Organization Example: 2GIS on Apify
A saved-record charge requires different arithmetic from an API-credit allowance. My 2GIS Scraper guide documents a separate example. The public Actor listing, checked October 3, 2026, lists an undiscounted $4.50 per 1,000 organizations saved, plus a start event whose amount was not shown in the listing checked on that date.
Disclosure: I develop this Actor and earn revenue from its use. This is an explanation of its billing unit, not an independent provider ranking.
At that organization-event rate, 2,000 saved organizations produce a $9 organization component. If an assumed 1,200 pass your acceptance rule, that component becomes $7.50 per 1,000 accepted organizations. The acceptance count is hypothetical. Both amounts exclude the unknown start-event amount and any other applicable charges.
Do not compare $7.50 directly with the ScraperAPI allocation above and announce a winner. The billing units, workflows, subscription utilization and missing components differ. Obtain equivalent accepted outputs and complete charges before making a purchase comparison. The Apify platform guide provides context for Actor workflows and exports; confirm the particular Actor’s current billing separately.
Download and Reproduce the Model
Download the inputs and calculations, then reproduce all 36 scenarios locally. The JSON includes a data dictionary, narrow source provenance and explicit assumption flags. The other formats contain the same scenario rows.
- CSV spreadsheet
- JSON dataset and methodology
- JSONL records
- Standalone Node.js generator and calculation fixtures
Save the generator and run it with Node.js 22 or later:
node growth-cost-models.mjs --out ./data
node growth-cost-models.mjs --out ./data --check
The dependency-free generator makes no network calls. It reproduces this dataset and the accompanying email and CRM models. Seven hand-calculated fixtures cover capacity, overflow and denominator examples across those models; this article is supported by the scraping cases. Fractional monetary outputs retain six decimal places. A chart may round displayed labels.
When citing the work, use: Tugelbay Konabayev, “Scraping Cost per Usable Record: 36 Authored Scenarios,” October 3, 2026, model version 1.0.0. Cite the official pricing page separately for the observed subscription input. Describe the dataset as authored scenarios, not measured extraction results.
Apply the Model to a Buying Decision
Use the model to identify the next fact you need before spending. If request cost drives the result, verify the billable configuration. If acceptance dominates, review the output against your actual schema. If the allocation looks inexpensive but utilization is low, budget the full subscription cash requirement.
Write down the target output, acceptance rule, billing unit and unknown charges before requesting a quote. For help defining that workflow, web scraping and automation services cover collection and integration scoping. A marketing audit is relevant when the larger question is how collected data enters your marketing process.
FAQ
Is the allocated cost my actual scraping bill?
No. Allocation spreads the $49 monthly base across 100,000 included credits. A workload consuming 6,250 credits receives a $3.0625 allocation, but purchasing that monthly subscription still costs $49 before tax or other applicable charges. Unused allowance does not turn this calculation into pay-as-you-go billing.
Are the 50%, 80% and 100% acceptance fractions measured?
No. They are deliberately selected sensitivity inputs. The dataset contains no new provider run, customer sample or observed quality benchmark. Replace them with a suitable planning assumption informed by your own documented acceptance process, retaining the uncertainty and the correct billable denominator.
Why are some prices empty in the CSV?
Those scenarios require more than Hobby’s observed 100,000-credit allowance. The checked page lists larger options, including Startup at $149 per month for 1,000,000 credits, and mentions pay-as-you-go without specifying a rate. This model does not map the workload onto another plan or validate its configuration, so its monetary fields remain unmodeled. Empty cells represent JSON null, not a free service or a zero-cost outcome.
Does a lower cost per accepted record identify the best provider?
Not by itself. Required fields, source permissions, freshness, support, processing time and integration effort may differ. Compare equivalent accepted outputs and complete billable components. These scenarios demonstrate sensitivity to assumptions and do not rank providers or establish extraction performance.
Last verified: October 3, 2026. Official subscription and Actor listing inputs were checked on that date. Scenario acceptance fractions and request-credit rates are authored assumptions; the calculations are reproducible, and no new extraction benchmark was conducted for this article.
Web Scraping Automation
Apify scrapers, data extraction pipelines, and scheduled monitoring workflows.
View service detailsGoogle Preferred Sources
See more of my research in Google
Add Konabayev.com as a preferred source to find more fresh marketing and AI research in Google Search.
Have a relevant product or documented use case? View sponsorship formats and editorial requirements.