Customer Onboarding Statistics 2026: Time-to-Value and Activation
Free Tool· No signup
LTV:CAC Calculator
Calculate customer lifetime value and acquisition cost ratio for SaaS. Healthy ratio is 3:1 or higher — see where you stand.
Use FreeAuthor's Take
SaaS growth comes down to unit economics: if your LTV:CAC ratio is below 3:1, scaling marketing will only accelerate losses. Fix the fundamentals first.
Review My MetricsDirect Answer
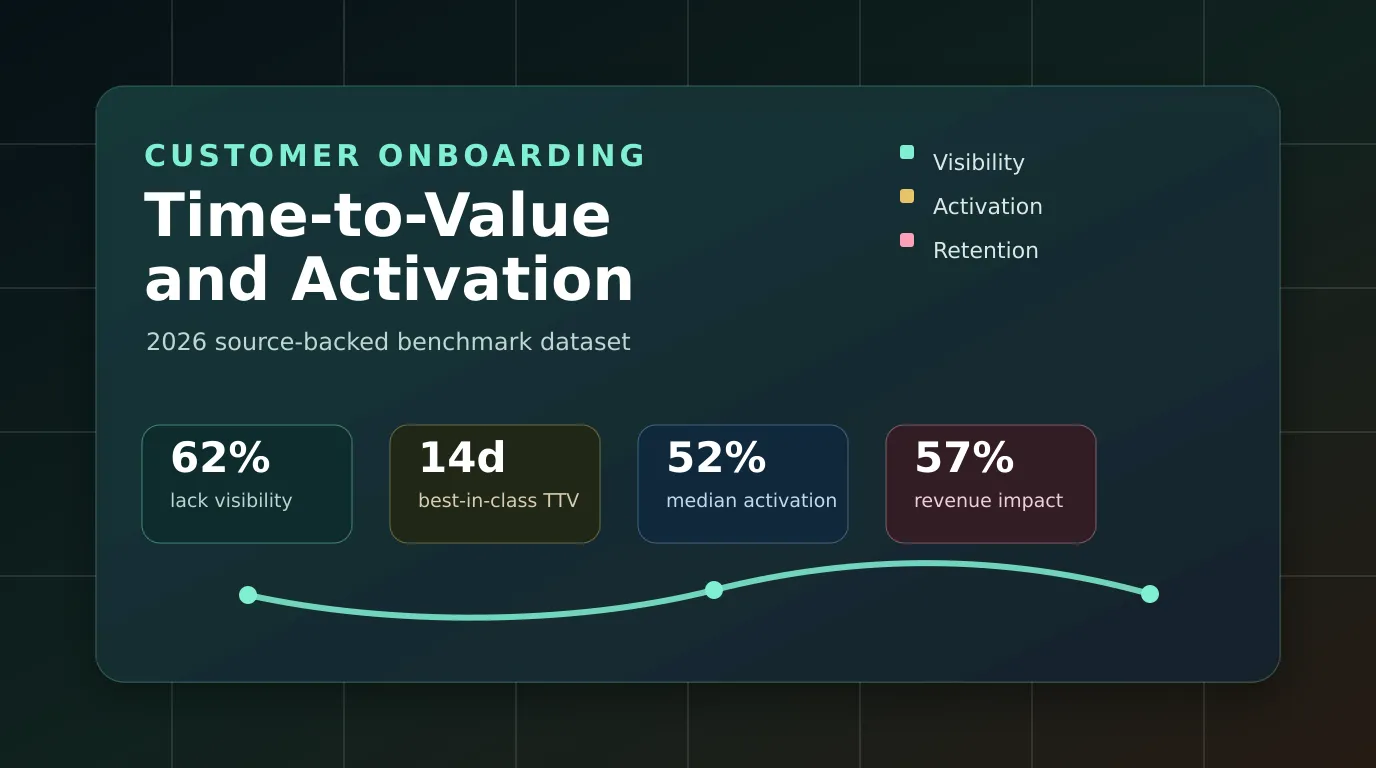
Customer onboarding in 2026 is a revenue function, not a support checklist: OnRamp found that 62% of CS leaders lack real-time onboarding visibility, 57% say onboarding friction directly affects revenue realization, and best-in-class teams reach time to first value in under 14 days.
The operating lesson is simple. If customers do not see value quickly, the risk shows up in trial conversion, usage, churn, renewal confidence and expansion readiness. OnRamp’s 2026 survey also found that 57% of companies that reduced onboarding investment saw churn increase within six months, while ChartMogul’s SaaS GTM data shows trial-to-paid conversion peaking around day 7. For self-serve SaaS, 1Capture reports a median time to first value of 22 minutes and top-quartile time to first value of 8 to 12 minutes.
Use this report alongside free trial conversion benchmarks, B2B customer retention statistics, customer retention, SaaS marketing, marketing automation statistics and B2B SaaS conversion benchmarks when planning onboarding, activation and post-sale revenue programs.
Cite This Report
Use this URL when citing this report: https://konabayev.com/blog/customer-onboarding-statistics-2026/. Suggested citation: Konabayev, T. (2026). Customer Onboarding Statistics 2026: Time-to-Value and Activation. konabayev.com. Last verified May 18, 2026.
Machine-readable copies are available here:
- CSV: /data/customer-onboarding-statistics-2026.csv
- JSON: /data/customer-onboarding-statistics-2026.json
- JSONL: /data/customer-onboarding-statistics-2026.jsonl
Primary source pages used in this report: OnRamp 2026 State of Customer Onboarding, OnRamp AI Customer Onboarding report summary, ChartMogul SaaS Go-To-Market Report, ChartMogul SaaS Conversion Report, 1Capture free trial conversion benchmarks, Userpilot State of SaaS Onboarding and ZapScale Customer Success Survey 2025.
Top Customer Onboarding Statistics
The most useful 2026 onboarding benchmarks connect visibility, speed and revenue: 62% of leaders lack real-time progress visibility, 57% connect onboarding friction to revenue realization, and best-in-class teams use under 14 days as the time-to-first-value target.
| Statistic | Figure | Source |
|---|---|---|
| CS leaders lacking real-time visibility into customer onboarding progress | 62% | OnRamp |
| Leaders who do not know where customers stand in onboarding at any given time | 1 in 3 | OnRamp |
| Leaders saying onboarding friction directly affects revenue realization | 57% | OnRamp |
| Companies cutting onboarding investment and seeing churn increase within six months | 57% | OnRamp |
| Onboarding teams reporting into CRO or Revenue Operations | 57% | OnRamp |
| Companies with dedicated onboarding functions | 69% | OnRamp |
| SaaS companies actively investing in onboarding automation | 26% | OnRamp |
| Companies still using four to six tools for customer onboarding | 60% | OnRamp |
| CS leaders expecting AI to handle at least half of onboarding tasks by 2027 | 70% | OnRamp |
| Best-in-class time to first value | Under 14 days | OnRamp |
| Best-in-class onboarding completion rate | Above 80% | OnRamp |
| Best-in-class post-onboarding CSAT | 4.5 out of 5 or higher | OnRamp |
| Median SaaS trial time to first value | 22 minutes | 1Capture |
| Top-quartile SaaS trial time to first value | 8 to 12 minutes | 1Capture |
| Median SaaS activation rate | 52% | 1Capture |
| Top-quartile SaaS activation rate | 65% to 75% | 1Capture |
| SaaS trial-to-paid conversions peaking around day 7 | Week 1 / day 7 | ChartMogul |
| B2B 7-day trial conversion example | 2.5% | ChartMogul |
| B2C 7-day trial conversion example | 16% | ChartMogul |
The main implication is that onboarding should be managed as a measurable revenue system. A welcome email sequence alone is not enough. The 2026 benchmark stack needs real-time progress tracking, clear handoff ownership, product activation events, time-to-value targets, customer-facing next steps, and a revenue view that connects onboarding completion to retention, expansion and renewal risk.
Time-to-Value Benchmarks
Time to value is the core onboarding metric because it measures how quickly a new customer reaches a meaningful outcome, not how quickly a team completes internal tasks.
OnRamp’s 2026 State of Customer Onboarding report gives a B2B post-sale benchmark: best-in-class teams reach time to first value in under 14 days. That benchmark fits implementation-heavy products where value depends on data migration, integrations, team enablement or workflow change. It should not be compared directly with consumer-style activation benchmarks.
For self-serve SaaS trials, 1Capture reports a much shorter time-to-value curve. Its 2025 benchmark places median time to first value at 22 minutes, top-quartile time to first value at 8 to 12 minutes, top-10% performance at under 5 minutes, and elite performance at under 2 minutes. The difference is not a contradiction. It reflects two onboarding motions: post-sale customer implementation versus product-led trial activation.
| Onboarding motion | Time-to-value benchmark | Use this when |
|---|---|---|
| B2B implementation onboarding | Under 14 days | Customer is already sold and needs to go live |
| Median SaaS trial activation | 22 minutes | User signs up and needs a first meaningful outcome |
| Top-quartile SaaS trial activation | 8 to 12 minutes | Product has a self-serve activation path |
| Top-10% SaaS trial activation | Under 5 minutes | Product can deliver value with minimal setup |
| Elite SaaS trial activation | Under 2 minutes | Product can show value before deep configuration |
The practical takeaway is to define the “first value” event before designing the checklist. For analytics software, that might be a first dashboard. For a marketing automation tool, it might be the first campaign created or launched. For implementation-heavy B2B software, it might be the first workflow live with real customer data. Without that event definition, onboarding teams can report activity while customers still have not reached value.
Activation and Trial Conversion
Activation is the strongest bridge between onboarding and conversion: 1Capture reports a 52% median activation rate, 65% to 75% top-quartile activation, and 90%+ elite activation across its SaaS trial benchmark.
ChartMogul’s SaaS Go-To-Market Report adds timing pressure. In its analysis of 2,500 SaaS companies, trial-to-paid conversions peak in week one and most conversions happen around day 7. The report’s B2B example shows 2.5% conversion at day 7 versus 16% for B2C, making the first week the key window for product education, activation nudges and sales-assist handoffs.
The activation benchmark should be interpreted with the product model. A developer tool can define activation as a first API call. A CRM can define it as a first imported contact list plus one completed follow-up. A reporting tool can define it as a first generated report. The wrong activation event creates false confidence: users may complete a tour while never reaching the outcome that predicts retention.
| Activation metric | Median | Top quartile | Elite |
|---|---|---|---|
| Activation rate | 52% | 65% to 75% | 90%+ |
| Time to first value | 22 minutes | 8 to 12 minutes | Under 2 minutes |
| Day-1 activation | 45% | 65% | 80%+ |
| Setup completion | 60% | 80% | 95%+ |
| Day-2 return rate | 50% | 70% | 85%+ |
For onboarding teams, this means the first week should be designed around one narrow win. Product tours, checklists and emails are only useful if they move the user toward that win. If the customer completes five checklist tasks but still does not understand the product’s value, the onboarding flow is busy rather than effective.
Visibility and Process Gaps
The biggest onboarding operating gap is visibility: OnRamp found that 62% of CS leaders lack real-time visibility into onboarding progress and one in three do not know where customers stand at any given time.
That visibility problem explains why onboarding often feels reactive. Teams cannot intervene early if progress data is scattered across email, spreadsheets, Slack, implementation calls and project management tools. OnRamp also found that 60% of companies still use four to six different tools for customer onboarding, while only 13% of SMBs use a purpose-built onboarding solution.
The customer experience suffers from the same fragmentation. OnRamp cites 87% of customers expecting a consistent experience across touchpoints. If onboarding is managed through disconnected tools, the customer receives duplicated requests, unclear ownership and inconsistent status updates. That slows time to value even when the product itself is not the blocker.
| Visibility or process benchmark | Figure | Source |
|---|---|---|
| CS leaders lacking real-time onboarding visibility | 62% | OnRamp |
| Leaders who do not know current onboarding status | 1 in 3 | OnRamp |
| Customers expecting consistent experience across touchpoints | 87% | OnRamp |
| Companies using four to six onboarding tools | 60% | OnRamp |
| SMBs using purpose-built onboarding software | 13% | OnRamp |
| Teams using real-time tracking that report increased engagement | 96% | OnRamp |
The fix is not just another dashboard. Teams need a single accountable owner, a shared milestone model, customer-facing next steps, and a health signal that tells CS, RevOps and leadership when onboarding is stuck. Without that, teams discover risk after the customer has already lost momentum.
Automation and AI
AI is already affecting onboarding, but maturity is low: OnRamp’s AI onboarding survey found that 89% of leaders say AI reduced friction, while only 17% rate their AI maturity as advanced.
OnRamp’s separate AI Customer Onboarding report surveyed 150 customer success and revenue leaders. The early outcome numbers are strong: 89% say AI reduced onboarding friction, 91% say AI improved customer-facing communication, 92% report improved customer satisfaction scores, and 88% say AI helps scale onboarding without adding headcount.
The maturity numbers are the warning. Only 22% have deployed AI across all customer segments, 25% have AI embedded end to end across onboarding workflows, and 17% rate maturity as advanced. The most common failure mode is reactive AI: 96% use AI to surface next steps for customers, but only 38% say those next steps are truly actionable, and 95% describe their AI as mostly reactive rather than predictive.
| AI onboarding metric | Figure | Source |
|---|---|---|
| Leaders saying AI reduced onboarding friction | 89% | OnRamp AI report |
| Leaders saying AI improved customer-facing communication | 91% | OnRamp AI report |
| Leaders reporting improved CSAT scores | 92% | OnRamp AI report |
| Leaders saying AI scales onboarding without adding headcount | 88% | OnRamp AI report |
| Teams deploying AI across all customer segments | 22% | OnRamp AI report |
| Teams embedding AI end to end across onboarding workflows | 25% | OnRamp AI report |
| Leaders rating AI maturity as advanced | 17% | OnRamp AI report |
| Teams using AI to surface next steps | 96% | OnRamp AI report |
| Teams saying AI next steps are truly actionable | 38% | OnRamp AI report |
The 2026 AI lesson is therefore operational, not cosmetic. AI helps when onboarding workflows, milestones and engagement data are already structured. If the process is messy, AI produces summaries of mess. If the process is clean, AI can detect stalled accounts, personalize next steps, automate reminders and show leaders where revenue is at risk.
Revenue, Churn and Ownership
Onboarding now belongs in the revenue conversation: OnRamp found that 57% of leaders say onboarding friction directly affects revenue realization and 57% of onboarding teams report to CRO or Revenue Operations.
The churn signal is equally direct. OnRamp reports that 57% of companies that reduced onboarding investment saw churn increase within six months. That makes onboarding one of the few customer success investments with a short feedback loop. If implementation slows, value is delayed. If value is delayed, adoption weakens. If adoption weakens, renewal and expansion become harder.
The operating model is changing in response. OnRamp found that 69% of companies have dedicated onboarding functions rather than relying only on generalist CSMs. That specialization matters because onboarding needs repeatable playbooks, implementation capacity planning, milestone reporting, customer education and sales-to-CS handoff discipline.
| Revenue or ownership signal | Figure | Source |
|---|---|---|
| Leaders saying onboarding friction affects revenue realization | 57% | OnRamp |
| Companies cutting onboarding investment and seeing churn increase | 57% | OnRamp |
| Onboarding teams reporting to CRO or RevOps | 57% | OnRamp |
| Companies with dedicated onboarding functions | 69% | OnRamp |
| Companies actively investing in onboarding automation | 26% | OnRamp |
| CS professionals naming value realization as the most effort-heavy lifecycle stage | 34.7% | ZapScale |
| CS professionals naming onboarding as the top 2024 investment program | 56.4% | ZapScale |
ZapScale’s Customer Success Survey gives useful adjacent context. It found that value realization required the most effort in 2024 at 34.7%, while adoption and onboarding each accounted for 22.8%. It also found onboarding was the top 2024 investment priority at 56.4%. For 2025 planning, self-service resources led at 51.5%, success plans followed at 44.6%, onboarding remained at 39.6%, and in-app guides reached 35.6%.
Self-Serve and Product-Led Onboarding
Self-serve onboarding is now common enough that customers expect to try before they buy: Userpilot found that 74% of the 100 SaaS tools it reviewed offered a free trial and 41% offered a free account.
Userpilot’s State of SaaS Onboarding research also found that only 4% of the reviewed SaaS companies were demo-only. That means onboarding starts before a sales conversation for many products. The first impression is not a slide deck or a discovery call. It is a signup flow, an empty state, an in-app checklist, a tooltip, a template, a sample dataset or a first-use email.
ChartMogul’s 2026 SaaS Conversion Report supports the same shift. Across 200 software products, 57% used a free trial as the primary entry point for new customers, 26% used freemium, 7% used a reverse trial, 7% used an interactive demo, and 4% used a paid trial. The most common trial length was 14 days, used by 62% of products.
| Entry model benchmark | Figure | Source |
|---|---|---|
| SaaS tools offering a free trial in Userpilot review | 74% | Userpilot |
| SaaS tools offering a free account in Userpilot review | 41% | Userpilot |
| Demo-only SaaS tools in Userpilot review | 4% | Userpilot |
| Products using free trial as primary entry point | 57% | ChartMogul |
| Products using freemium as primary entry point | 26% | ChartMogul |
| Products using reverse trial | 7% | ChartMogul |
| Products using interactive demo | 7% | ChartMogul |
| Products using paid trial | 4% | ChartMogul |
| Products using a 14-day trial | 62% | ChartMogul |
The product-led lesson is to remove dead steps. If the customer needs a spreadsheet import, make sample data available. If they need integrations, show value before requiring every connection. If they need a team, let one user get a win before asking for invitations. The best onboarding path is not the most complete path. It is the shortest credible path to value.
Methodology and Limitations
This report uses source-locked public claims from 2025 and 2026 onboarding, activation, SaaS conversion and customer success research, then separates post-sale implementation benchmarks from self-serve trial activation benchmarks.
The strongest customer-onboarding-specific source is OnRamp’s 2026 State of Customer Onboarding, based on 161 onboarding and customer success leaders. OnRamp’s AI onboarding report adds a separate 150-leader dataset for automation and AI maturity. ChartMogul contributes subscription and trial timing context from 2,500 SaaS companies and a 200-product conversion study. 1Capture contributes trial activation and time-to-value bands from a vendor-published benchmark. Userpilot contributes observed onboarding-flow patterns from more than 100 SaaS tools. ZapScale contributes customer success investment and lifecycle-effort context.
| Source | Evidence base | How it is used |
|---|---|---|
| OnRamp State of Customer Onboarding 2026 | 161 onboarding and CS leaders | Visibility, revenue impact, automation, ownership and best-in-class post-sale benchmarks |
| OnRamp AI Customer Onboarding 2026 | 150 CS and revenue leaders | AI outcome and maturity benchmarks |
| ChartMogul SaaS GTM Report | 2,500 SaaS companies | Trial conversion timing and day-7 urgency |
| ChartMogul SaaS Conversion Report | 200 B2B software products | Trial, freemium and entry-model benchmarks |
| 1Capture free trial benchmarks | 10,000+ SaaS companies claimed by publisher | Activation and time-to-value bands, with vendor-published caveat |
| Userpilot State of SaaS Onboarding | 100+ SaaS tools reviewed | Self-serve onboarding and trial/freemium adoption signals |
| ZapScale Customer Success Survey 2025 | Customer success survey respondents | Lifecycle effort and investment priorities |
Several sources are vendor-published and should be treated as benchmark signals, not audited causal proof. OnRamp is deeply relevant to B2B onboarding but is also an onboarding software vendor. 1Capture’s benchmark is useful for activation bands, but its methodology is publisher-reported. Userpilot’s 2023 onboarding review is older than the 2026 sources, so this report uses it only for structural onboarding-flow context. Do not mix post-sale B2B implementation benchmarks with self-serve trial benchmarks without segmenting by product complexity, ACV, buyer role and activation event.
How to Use These Benchmarks
The right onboarding benchmark depends on the onboarding motion: implementation-heavy B2B teams should measure days to live value, while self-serve SaaS teams should measure minutes to first meaningful outcome.
Use this scorecard before changing the onboarding flow:
| Question | Metric to compare | Primary source anchor |
|---|---|---|
| Do we know where every customer stands? | Real-time onboarding visibility | OnRamp |
| Are customers reaching value fast enough? | Time to first value | OnRamp or 1Capture depending on motion |
| Are trial users converting in the first week? | Day-7 trial conversion | ChartMogul |
| Are users completing the right activation event? | Activation rate and day-1 activation | 1Capture |
| Is onboarding affecting revenue? | Revenue realization, churn and renewal risk | OnRamp |
| Can the team scale without headcount? | Automation, AI coverage and self-service resources | OnRamp and ZapScale |
| Does the entry model match buyer behavior? | Free trial, freemium, demo or paid trial mix | ChartMogul and Userpilot |
Do not optimize onboarding for completion alone. Completion can be gamed with shallow steps. The better test is whether customers reach value, return, invite the right stakeholders, complete setup, use the feature that predicts retention, and understand the next milestone. A shorter onboarding path that creates a real outcome is stronger than a longer path that explains every feature.
FAQ
What is a good customer onboarding time-to-value benchmark in 2026?
For B2B post-sale onboarding, OnRamp’s best-in-class benchmark is time to first value in under 14 days. For self-serve SaaS trials, 1Capture reports a median time to first value of 22 minutes and a top-quartile band of 8 to 12 minutes. The right benchmark depends on whether onboarding requires implementation work or only in-product activation.
What activation rate should SaaS teams target?
1Capture reports median SaaS trial activation at 52%, top-quartile activation at 65% to 75%, top-10% activation at 80% to 85%, and elite activation at 90%+. Teams should define activation as the first action that predicts retained value, not as completion of a generic tour.
Why does onboarding visibility matter?
OnRamp found that 62% of CS leaders lack real-time onboarding visibility and one in three leaders do not know where customers stand at any given time. Without visibility, teams intervene late, leadership cannot forecast risk, and customers receive unclear next steps across disconnected tools.
Is customer onboarding a revenue function?
Increasingly, yes. OnRamp found that 57% of leaders say onboarding friction directly affects revenue realization and 57% of onboarding teams now report into the CRO or Revenue Operations. Onboarding also affects churn because delayed value weakens adoption and renewal confidence.
How is AI changing customer onboarding?
OnRamp’s AI onboarding research found that 89% of leaders say AI reduced onboarding friction, 91% say it improved customer-facing communication, and 88% say it helps scale onboarding without adding headcount. The limitation is maturity: only 17% rate their AI onboarding maturity as advanced.
What is the difference between onboarding completion and activation?
Onboarding completion means the user or customer finished assigned steps. Activation means they reached a meaningful product outcome that predicts future value. A customer can complete onboarding and still fail to activate if the steps teach features without getting the customer to a real win.
Last verified: May 2026
Ready to grow your business?
Get a marketing strategy tailored to your goals and budget.
Start a Project